Overview
The Market Evaluation page allows you to choose a specific market and product (code set) to analyze based on patient location. In short, you select the market and code set of interest, and the tables will display the related claim counts by payers, by physicians, and by billing entities.
![]() All tables include claim counts for each listed entry for the most recent four quarters of data and for the most recent six quarters to provide a trended view.
All tables include claim counts for each listed entry for the most recent four quarters of data and for the most recent six quarters to provide a trended view.
| Click on the "Market Evaluation" button in the left navigation to open the Market Evaluation page. |  |
 In this article
The Market Evaluation page includes the following three tables (middle three entries).
- Choosing Market and Code Set - Before you view the tables, you can choose what you will see in each table.
- 3 Digit ZIP Code Report with map -
- Claim Counts by Payer Type - Claim volume for Medicare FFS, MA, Medicaid, Commercial and other plans
- Physicians by Code Set by Patient Location - claim counts by physician for patients who reside in the selected location
- Billing Entities by Code Set by Patient Location - claim counts by organizational billing entities for patients who reside in the selected location
- FAQs
Choosing Market and Code Set
Report type
State Report
| The next step before looking at the tables, you will need to set up the market and code set you want to analyze. To do this you will use the filters at the top of the page. | |
 |
|
| Click on the "Patient Location" button to choose a market to analyze. | |
|
You can type in the state abbreviation in the top search field or scroll through the list to find the state of your choice. Click on the checkbox to the left of the name to select the state.
|
 |
|
Next you will need to choose the Code Set you want to use in your evaluation. Click on the "Code Set" button to open the options |
|
|
You can type the Code Set name in the search field if you know it, or scroll through the list until you find the Code Set of interest. Click on the checkbox to the left of the name to select the Code Set.
|
 |
|
Once you are done making your selections, click on the "Apply Filters" button. |
|
![]() Once you make you selection and click the "Apply Filters" button, your selections will be applied to all tables on the page. Your selections will be displayed above each table. Your selections will be referred to as the "specified" code set and state in the definitions in the tables.
Once you make you selection and click the "Apply Filters" button, your selections will be applied to all tables on the page. Your selections will be displayed above each table. Your selections will be referred to as the "specified" code set and state in the definitions in the tables.
3-digit ZIP code Report with map
Understanding the Metrics
Claim Counts by Payer Type

![]() Above each table on the Market Evaluation page the state and code set selected using the filters at the top are listed as a reminder. In the definitions in the table, these are called the "specified" state and code set. The table will show metrics that pertain to the selected state and code set.
Above each table on the Market Evaluation page the state and code set selected using the filters at the top are listed as a reminder. In the definitions in the table, these are called the "specified" state and code set. The table will show metrics that pertain to the selected state and code set.
![]() The table name identifies what will be shown in the table. The "Claim Counts" in this table are "line counts of estimated claims attributed to the listed payer." The different payers are listed in the leftmost column along with a total patient count in the bottom row.
The table name identifies what will be shown in the table. The "Claim Counts" in this table are "line counts of estimated claims attributed to the listed payer." The different payers are listed in the leftmost column along with a total patient count in the bottom row.
![]() Click the "Excel" button to download the metrics shown in the table for use in an Excel spreadsheet.
Click the "Excel" button to download the metrics shown in the table for use in an Excel spreadsheet.
![]() The leftmost column shows the payer for which the metrics in the row were counted.
The leftmost column shows the payer for which the metrics in the row were counted.
![]() Although each of the row names includes the word "patients," the counts in each row are not counts of patients, but "line counts" from claims for, for example, "Medicare FFS patients." Since the table is a list of payers, you can remove the word "patients" from the row header to consider the payer as Medicare FFS, MA, Medicaid, Commercial, or Other.
Although each of the row names includes the word "patients," the counts in each row are not counts of patients, but "line counts" from claims for, for example, "Medicare FFS patients." Since the table is a list of payers, you can remove the word "patients" from the row header to consider the payer as Medicare FFS, MA, Medicaid, Commercial, or Other.
![]() The first column of counts is an annual count - Based on the specified (selected) state and code set, this metric is a line count of estimated claims attributed to the listed payer during the one-year reporting period. Since this is a count of applicable lines rather than patients, the counts in this column are a total of the counts from the most recent four quarters.
The first column of counts is an annual count - Based on the specified (selected) state and code set, this metric is a line count of estimated claims attributed to the listed payer during the one-year reporting period. Since this is a count of applicable lines rather than patients, the counts in this column are a total of the counts from the most recent four quarters.
![]() The remaining columns are quarterly trended counts. - Based on specified (selected) state and code set, this metric is a line count of estimated claims attributed to the listed payer during the quarter specified in each header.
The remaining columns are quarterly trended counts. - Based on specified (selected) state and code set, this metric is a line count of estimated claims attributed to the listed payer during the quarter specified in each header.
![]() This field will help identify the number of claims for the selected product for each specified period, quarter or annual, based on patient location.
This field will help identify the number of claims for the selected product for each specified period, quarter or annual, based on patient location.
Physicians by Code Set by Patient Location
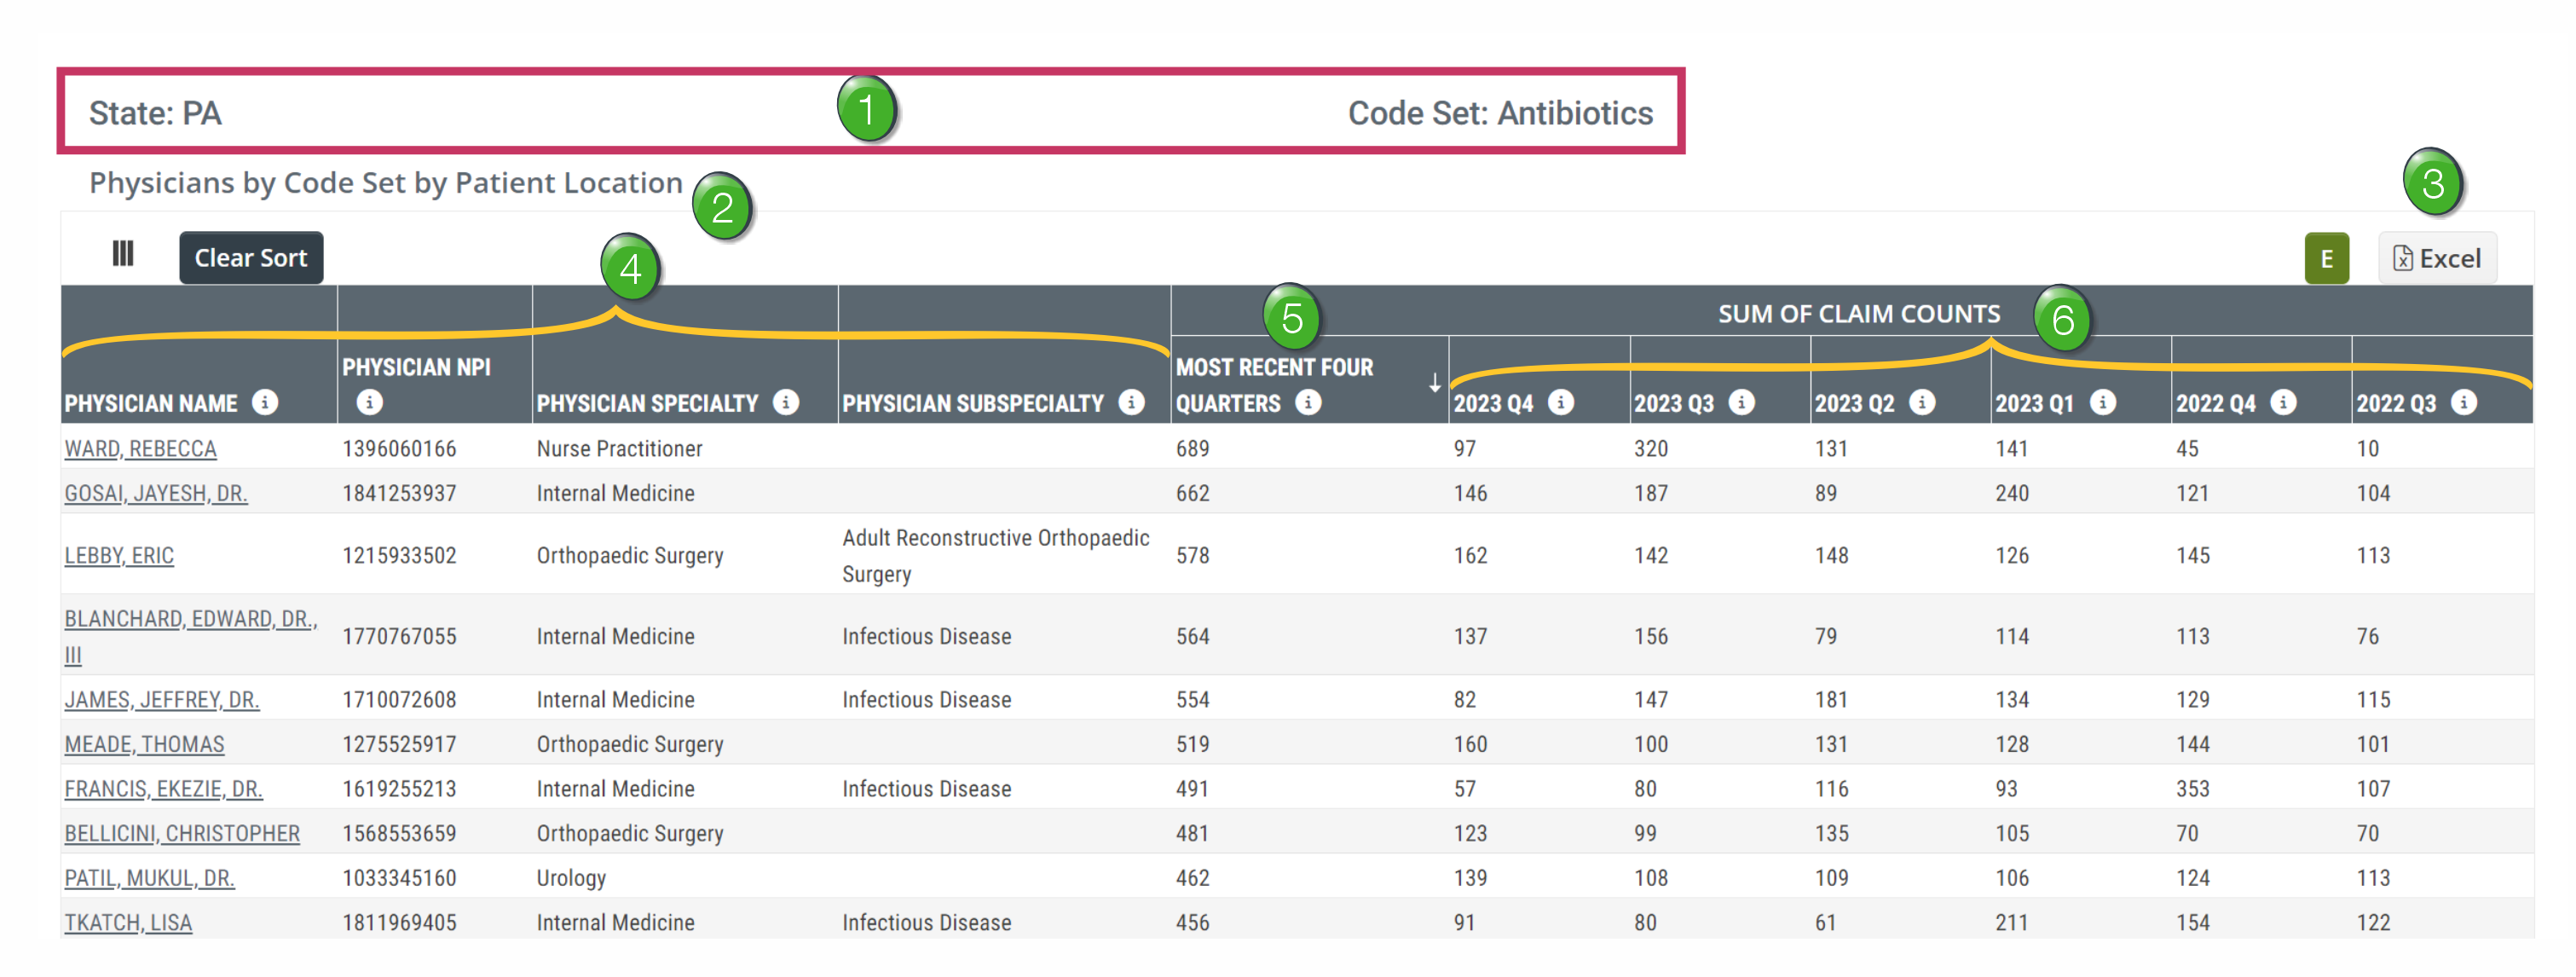
![]() Above each table on the Market Evaluation page the state and code set selected using the filters at the top are listed as a reminder. In the definitions in the table, these are called the "specified" state and code set. The table will show metrics that pertain to the selected state and code set.
Above each table on the Market Evaluation page the state and code set selected using the filters at the top are listed as a reminder. In the definitions in the table, these are called the "specified" state and code set. The table will show metrics that pertain to the selected state and code set.
![]() The table name identifies what will be shown in the table. The counts in each row are line counts of estimated claims submitted by the listed physician in each row.
The table name identifies what will be shown in the table. The counts in each row are line counts of estimated claims submitted by the listed physician in each row.
![]() Click the "Excel" button to download the metrics shown in the table for use in an Excel spreadsheet.
Click the "Excel" button to download the metrics shown in the table for use in an Excel spreadsheet.
![]() The leftmost column shows the Physician for which the metrics in the row were counted. Also included is the listed physician's NPI, specialty and sub-specialty.
The leftmost column shows the Physician for which the metrics in the row were counted. Also included is the listed physician's NPI, specialty and sub-specialty.
![]() The first column of counts is an annual count - Based on the specified (selected) state and code set, this metric is a line count of estimated claims attributed to the listed physician during the one-year reporting period. Since this is a count of applicable lines rather than distinct patients, the counts in this column are a total of the counts from the most recent four quarters.
The first column of counts is an annual count - Based on the specified (selected) state and code set, this metric is a line count of estimated claims attributed to the listed physician during the one-year reporting period. Since this is a count of applicable lines rather than distinct patients, the counts in this column are a total of the counts from the most recent four quarters.
![]() The remaining columns are quarterly trended counts. - Based on specified (selected) state and code set, this metric is a line count of estimated claims attributed to the listed physician during the quarter specified in each header.
The remaining columns are quarterly trended counts. - Based on specified (selected) state and code set, this metric is a line count of estimated claims attributed to the listed physician during the quarter specified in each header.
![]() This field will help identify the number of claims for the selected product for each listed physician for the latest year, or trended over 6 quarters for patients who lived in the selected market.
This field will help identify the number of claims for the selected product for each listed physician for the latest year, or trended over 6 quarters for patients who lived in the selected market.
Billing Entities by Code Set by Patient Location
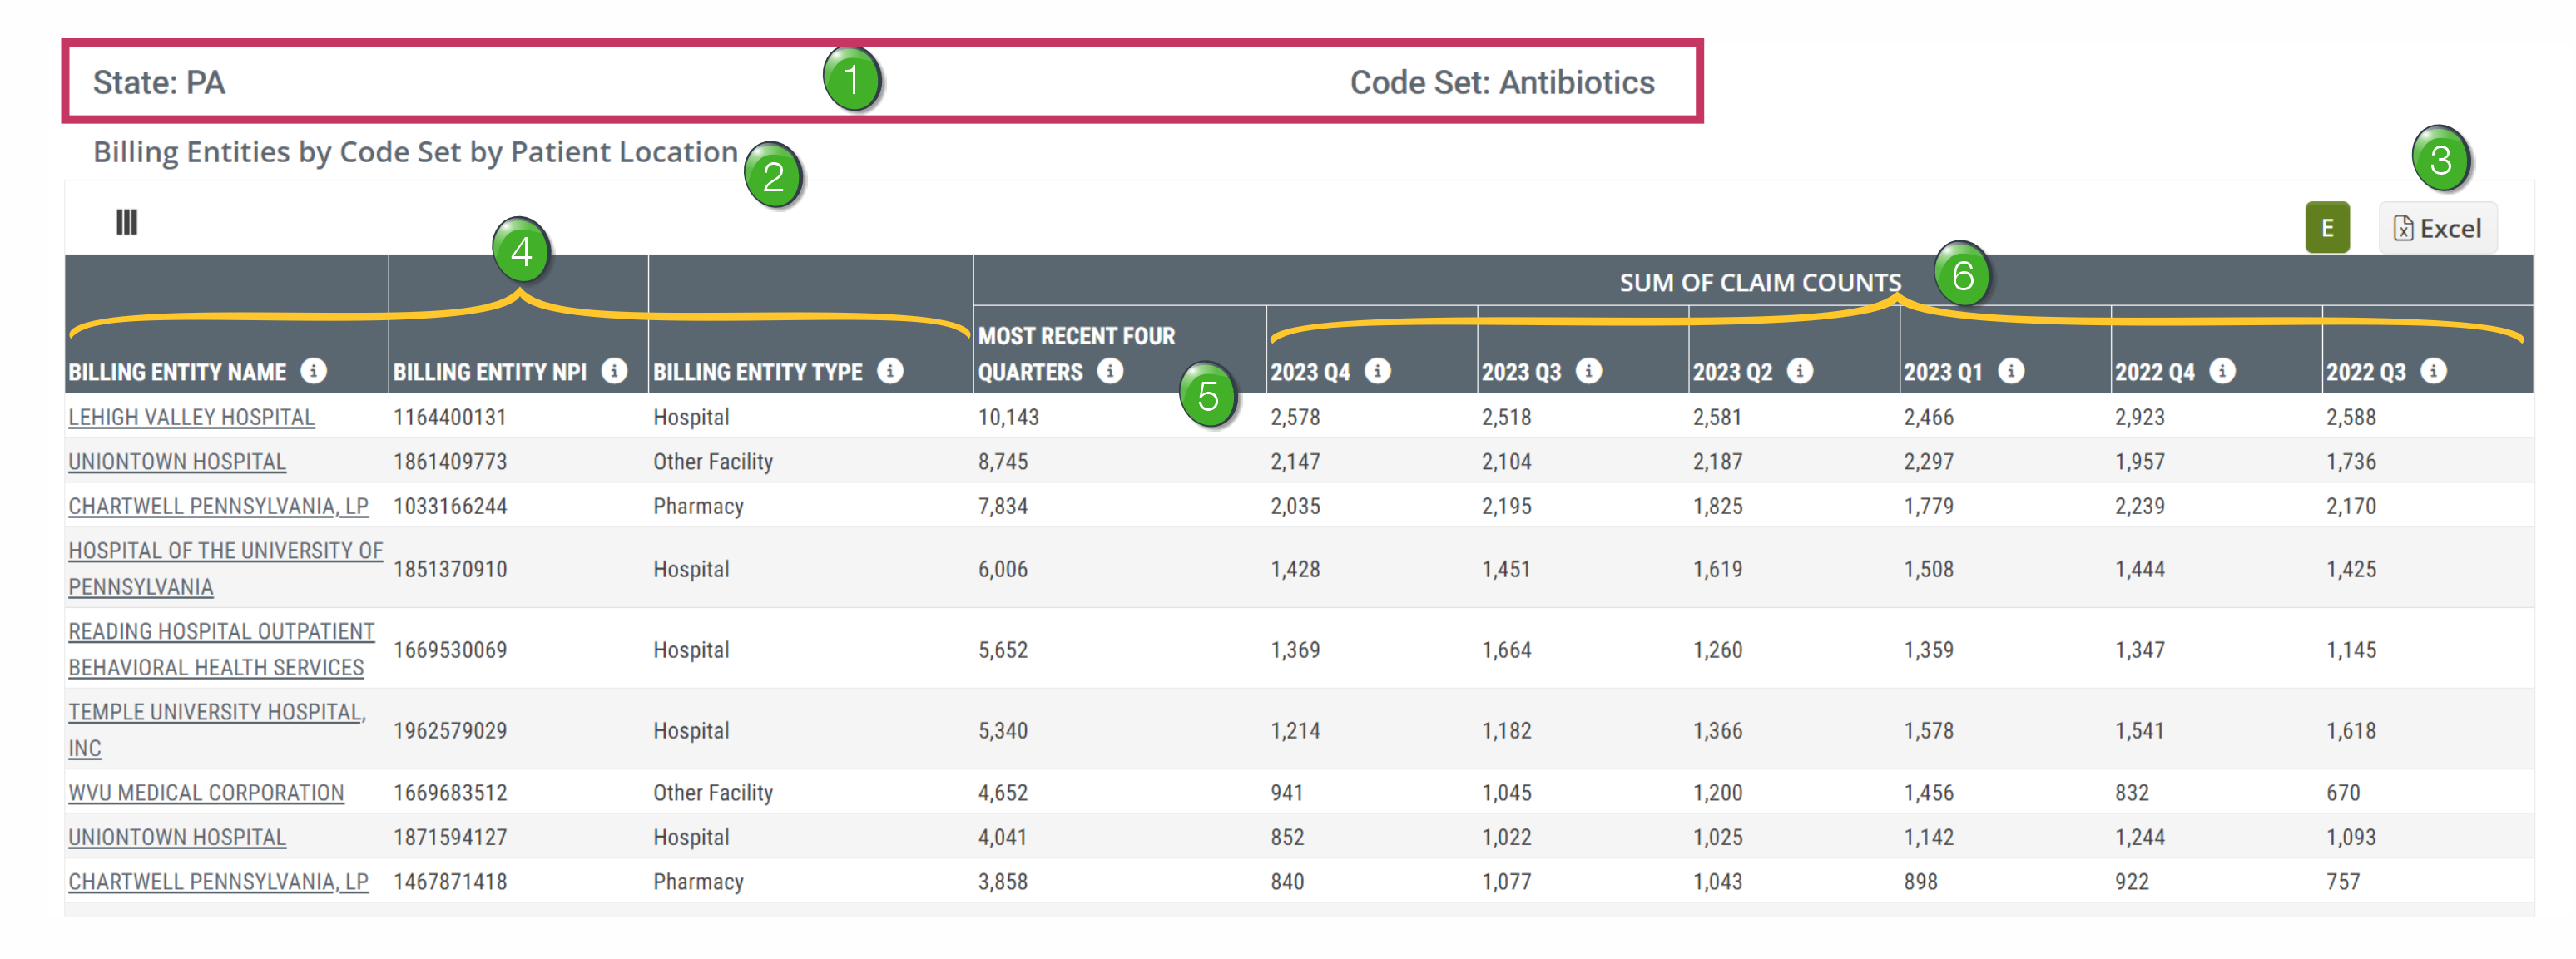
![]() Above each table on the Market Evaluation page the state and code set selected using the filters at the top are listed as a reminder. In the definitions in the table, these are called the "specified" state and code set. The table will show metrics that pertain to the selected state and code set.
Above each table on the Market Evaluation page the state and code set selected using the filters at the top are listed as a reminder. In the definitions in the table, these are called the "specified" state and code set. The table will show metrics that pertain to the selected state and code set.
![]() The table name identifies what will be shown in the table. The counts in each row are line counts of estimated claims submitted by the listed billing entity in each row.
The table name identifies what will be shown in the table. The counts in each row are line counts of estimated claims submitted by the listed billing entity in each row.
![]() Click the "Excel" button to download the metrics shown in the table for use in an Excel spreadsheet.
Click the "Excel" button to download the metrics shown in the table for use in an Excel spreadsheet.
![]() The leftmost column shows the billing entity for which the metrics in the row were counted. Also included is the NPI and the billing entity type.
The leftmost column shows the billing entity for which the metrics in the row were counted. Also included is the NPI and the billing entity type.
![]() The first column of counts is an annual count - Based on the specified (selected) state and code set, this metric is a line count of estimated claims attributed to the listed billing entity during the one-year reporting period. Since this is a count of applicable lines rather than distinct patients, the counts in this column are a total of the counts from the most recent four quarters.
The first column of counts is an annual count - Based on the specified (selected) state and code set, this metric is a line count of estimated claims attributed to the listed billing entity during the one-year reporting period. Since this is a count of applicable lines rather than distinct patients, the counts in this column are a total of the counts from the most recent four quarters.
![]() The remaining columns are quarterly trended counts. - Based on specified (selected) state and code set, this metric is a line count of estimated claims attributed to the listed billing entity during the quarter specified in each header.
The remaining columns are quarterly trended counts. - Based on specified (selected) state and code set, this metric is a line count of estimated claims attributed to the listed billing entity during the quarter specified in each header.
![]() This field will help identify the number of claims for the selected product for each listed billing entity for the latest year, or trended over 6 quarters for patients who lived in the selected market.
This field will help identify the number of claims for the selected product for each listed billing entity for the latest year, or trended over 6 quarters for patients who lived in the selected market.
FAQs
![]() What is the difference between the physicians listed on the Explore page and those listed on the Market Evaluation page?
What is the difference between the physicians listed on the Explore page and those listed on the Market Evaluation page?
Answer: Metrics for physicians shown in the table on the Explore page are based on the location of the physician’s registered NPI – metrics for physicians shown in the table on the Market Evaluation page are based on the location of the patients' residence.
If you were to export the metrics from the Physicians by Code Set by Patient Location table and the Billing Entities by Code Set by Patient Location table so that you could get a total count of claims for those tables, you would notice that the claim counts by quarter are different between the organizations, physicians, and payer mix. For example, if you select IVIG code set in GA, here are the total claims for the last four quarters by table:
Payer Mix: 100k
Physicians: 66k
Organizations: 68k
![]() Why is that?
Why is that?
Answer: Trella Health’s contract with CMS requires that any counts where there are less than 11 claims must be suppressed for privacy concerns. Any physicians or organizations whose code set and geographic region combination that did not have at least 11 claims within the Medicare FFS data were suppressed and not included in either that physician or organization count. However, when blended with other commercial sources, there are cases in which the contract with CMS does not apply and Trella can display claim counts that are less than 11.
