Overview
The Hospices Explore page includes one table that displays metrics for all hospices in the states your company has contracted to see. Through the use of filters, or by browsing and choosing favorites, you can display a selection of hospices in the table of interest to you.
![]() On the Physicians Explore page and the Facilities Explore page, the primary use case is to target specific providers for attention as potential referral sources. The Hospices Explore page is useful for comparing your hospice with other hospices to evaluate your competitive position. If you are developing new business and want to look for a potential merger or acquisition, this table will help you to evaluate hospices with potential.
On the Physicians Explore page and the Facilities Explore page, the primary use case is to target specific providers for attention as potential referral sources. The Hospices Explore page is useful for comparing your hospice with other hospices to evaluate your competitive position. If you are developing new business and want to look for a potential merger or acquisition, this table will help you to evaluate hospices with potential.
 In this article
- Let's get Oriented - Overview of the Skilled Nursing Explore page
- Understanding the Metrics - definitions for the metrics in the table
- Usage - some tips on using the Skilled Nursing Explore page
 Let's get Oriented
Observe the following image along with the details below. (Click on the image to enlarge it.)
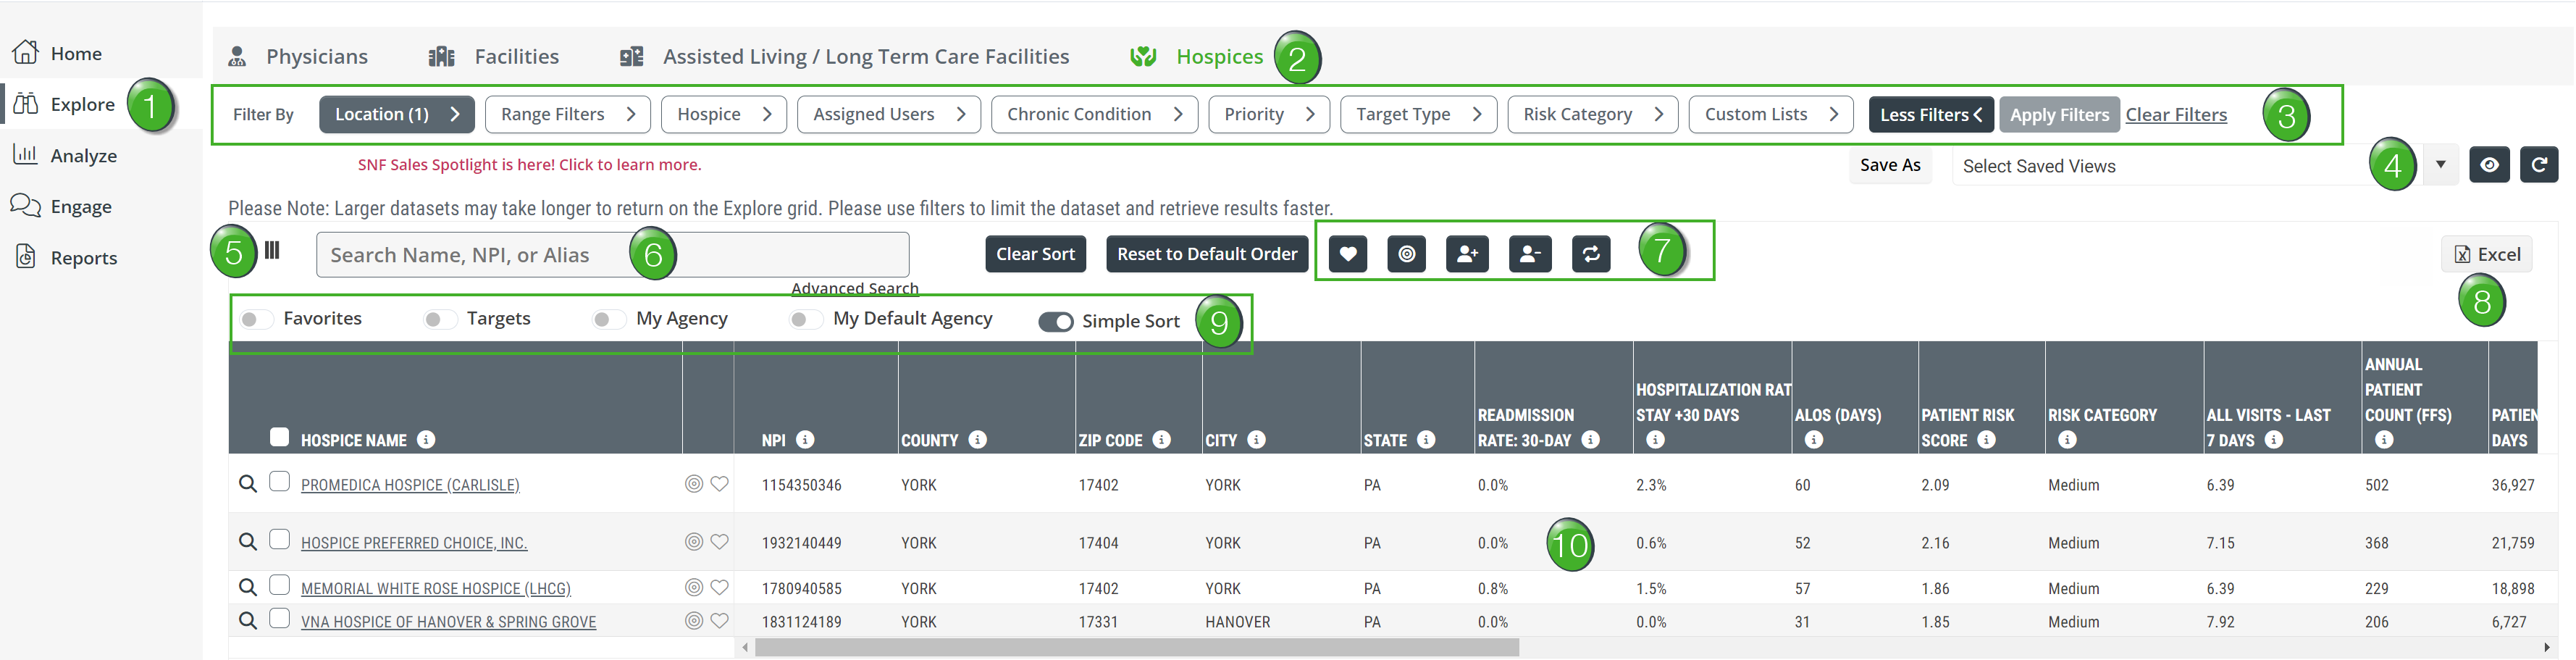
![]() Explore - Click on the "Explore" button in the left navigation to open the Explore page from any page in Marketscape Insights.
Explore - Click on the "Explore" button in the left navigation to open the Explore page from any page in Marketscape Insights.
![]() Provider tabs - The Explore page has four tabs listed near the top of the page. Clicking on each of the tabs will open up the Explore page for that provider type. The image shows that "Hospices" is highlighted by color indicating that the Hospices Explore page is active.
Provider tabs - The Explore page has four tabs listed near the top of the page. Clicking on each of the tabs will open up the Explore page for that provider type. The image shows that "Hospices" is highlighted by color indicating that the Hospices Explore page is active.
![]() Filters - The filters are a powerful tool that allows you to narrow the entries displayed in the table to hospices of particular interest. Once you have set up the filters, you can save them for future use. (See Views, next.)
Filters - The filters are a powerful tool that allows you to narrow the entries displayed in the table to hospices of particular interest. Once you have set up the filters, you can save them for future use. (See Views, next.)
![]() Strategy - In general, you will want to start by setting the "Location" filter so the hospices included in the table fit your territory of interest. Then, range filters will allow you to limit the hospices listed in the table to those with specific numbers of patients that you choose when you set the ranges.
Strategy - In general, you will want to start by setting the "Location" filter so the hospices included in the table fit your territory of interest. Then, range filters will allow you to limit the hospices listed in the table to those with specific numbers of patients that you choose when you set the ranges.
![]() For more information, see Using Filters.
For more information, see Using Filters.
![]() Views - Click on the "Select Saved View" dropdown to select a saved view. (You will see other views related to physicians that you can ignore.) A view is a saved set of filters and sorting that you have saved.
Views - Click on the "Select Saved View" dropdown to select a saved view. (You will see other views related to physicians that you can ignore.) A view is a saved set of filters and sorting that you have saved.
To save a view after you have set your filters, columns, and sorting, click on the "Save As" button. Then, choose a name that will show relevant details so you can pick out the saved view in the future.
![]() Column Select - Click the column icon
Column Select - Click the column icon ![]() to open the column selector tool. Clicking on the checkboxes will turn the listed column on and off in the table.
to open the column selector tool. Clicking on the checkboxes will turn the listed column on and off in the table.

If you click a column header with your mouse and drag the column, you can move the selected column to another location in the table. The "Reset" button shown above will restore your table to the original configuration.
![]() Table Search - If you are looking for a specific hospice, you can enter the name of the hospice, the NPI for the hospice, or any aliases that have been applied to the hospice. The table will automatically search for what you have typed into the field and display any hospice that matches the search in the table.
Table Search - If you are looking for a specific hospice, you can enter the name of the hospice, the NPI for the hospice, or any aliases that have been applied to the hospice. The table will automatically search for what you have typed into the field and display any hospice that matches the search in the table.
![]() Bulk Operations - If you click on one or more checkboxes to the left of any hospice listed in the table, you can then perform any of the actions below on the selected hospices.
Bulk Operations - If you click on one or more checkboxes to the left of any hospice listed in the table, you can then perform any of the actions below on the selected hospices.
Favorite - Make the selected hospices a favorite. Once made a favorite, any provider will be displayed on your home page. In addition, many tables can be filtered to show favorites.
Target - Make the selected hospices a target. Targets are like favorites except that you can add a category and a priority to a target. Once made a target, any provider will be displayed on your home page. In addition, many tables can be filtered to show targets.
Assign to another User - This will open a dialog box that will display the email addresses for everyone in your company who has an account in Marketscape Insights. You can then assign the selected hospices to a user or users by selecting the check box next to their name and saving your changes.
![]() Not every user has the ability to assign providers in Marketscape Insights. If you don't have permission to assign (or un-assign) users, you will not see this icon.
Not every user has the ability to assign providers in Marketscape Insights. If you don't have permission to assign (or un-assign) users, you will not see this icon.
Unassign from another User - This will open a dialog box that will display the email addresses for everyone in your company who has an account in Marketscape Insights. You can then unassign the selected hospices from a user or users by selecting the check box next to their name and saving your changes.
![]() Not every user has the ability to assign providers in Marketscape Insights. If you don't have permission to un-assign (or assign) users, you will not see this icon.
Not every user has the ability to assign providers in Marketscape Insights. If you don't have permission to un-assign (or assign) users, you will not see this icon.
Create a custom list - Clicking this button will allow you to name a custom list and save the list which will then be available for you to use again by using the "Custom Lists" filter. By opening a saved custom list, the selected hospices will populate the table. These custom lists can be used in many places in Marketscape Insights.
![]() Export to Excel - Clicking this button will download the current entries in the table to an Excel spreadsheet so you can work with the data
Export to Excel - Clicking this button will download the current entries in the table to an Excel spreadsheet so you can work with the data
![]() Quick Toggles - The toggles make immediate changes to the table.
Quick Toggles - The toggles make immediate changes to the table.
- Favorites - only show favorites in the table
- Targets - only show targets in the table
- My Agency - will show your company's "My Agency" list in the table
- My Default Agency - will show your selected default "My Agency" in the table
- Simple Sort - with this toggle on, you will only be able to sort based on one column at a time.
![]() Table Data - This is where you will find the results of your choices. Not all of the metrics are shown in the image above, but they are all listed below.
Table Data - This is where you will find the results of your choices. Not all of the metrics are shown in the image above, but they are all listed below.
Understanding the Metrics
The following image shows the headers from the top of the Hospices Explore table. To make the image a bit easier to see, we have sliced up the full spread of headers and stacked them. To make the image larger click on it.
The definitions are listed below the image.

| Column name | Description |
| Hospice Name/NPI | The name of the hospice and the NPI as listed in the NPI Registry. |
| State/County/Street Address/City/ZIP Code | Address information for the listed hospice. |
| Readmission Rate: 30-Day |
This rate is the percentage of the hospice's patients discharged from an inpatient setting, who were admitted to the listed hospice, and were subsequently readmitted to any hospital within 30 days of the first inpatient discharge (based on two years of discharges)
|
| Hospitalization Rate: Stay + 30 Days |
Hospitalization Rate is the percentage of the listed hospice's patients who were admitted to a short-term acute stay during their hospice care or within 30 days of hospice discharge during the two-year reporting period
|
| ALOS (Days) | Average Length of Stay for all patients discharged from hospice during the four quarters listed (does not include patients still in Hospice) |
| Patient Risk Score |
Average Hierarchical Condition Category (HCC) Patient Risk Score for the given NPI
|
| Risk Category |
Trella Health has created these categories to make a general comparison between agencies quick and easy.
|
| All Visits - Last 7 Days | For the listed hospice, this is the average number of visits by RNs, LPNs, social workers, and aides during the last 7 days of life for patients treated by the hospice during the one-year reporting period. |
| Annual Patient Count (FFS) | The count of Medicare FFS patients admitted to the listed hospice during the one-year reporting period. |
| Patient Days | This is the sum of patient days for the listed hospice during the one year reporting period. |
| Average Daily Census | Represents the average number of patients this facility serves daily; calculated by counting the number of patient days for the listed hospice during the one year reporting period, divided by 365 |
| MA Enrollees Prior to Hospice | This is the count of distinct Medicare FFS patients admitted to hospice during the one-year reporting period who were Medicare Advantage enrollees during the 30 days prior to hospice admission |
| RN Visits - Last 7 Days | The average number of registered nurse (RN) visits provided by the listed hospice to patients on routine home care during the last 7 days of life during the one-year reporting period |
| LPN Visits - Last 7 Days | The average number of licensed practical nurse (LPN) visits provided by the listed hospice to patients on routine home care during the last 7 days of life during the one-year reporting period |
| SW Visits - Last 7 Days | The average number of social worker (SW) visits provided by the listed hospice to patients on routine home care during the last 7 days of life during the one-year reporting period |
| Aide Visits - Last 7 Days | The average number of home health aide visits provided by the listed hospice to patients on routine home care during the last 7 days of life during the one-year reporting period |
| Highest Affiliated Owner |
Highest affiliated direct owner of the listed hospice. JV indicates Joint Venture. NP indicates Not for Profit. Additional owner details can be found on the Analyze page, under the Ownership tab.
|
| Highest Affiliated Owner Percentage | The percentage ownership of the highest affiliated direct owner of the listed hospice. Additional owner details can be found on the Analyze page Analyze. |
|
Chronic Condition - Annual Patient Count Only works with Chronic Condition filter in use |
The count of distinct patients treated during the one-year reporting period who met the criteria for the selected chronic condition based on the CCW Chronic Condition algorithm. |
| % Hospice Visits last days of life | Percentage of patients discharged from the listed hospice during the one-year reporting period who received visits from a Registered Nurse or Medical Social Worker (non-telephonically) on at least two out of the final three days of the patient's life. The measure is based on CMS HVLDC methodology. |
| HOS Assigned Users | The user(s) from your company assigned to the listed hospice. |
| Dual-Eligible Patients | The count of distinct Medicare FFS patients who were admitted to the hospice and were eligible for Medicaid coverage during the one-year reporting period. |
| Trella Estimated HCI Score |
Hospice Care Index (HCI) for the listed hospice; calculated by Trella Health as the sum of points earned from meeting the criterion for the 10 claims-based indicators (ranging from 0 to a perfect 10).
|
| CMS HCI Score |
Hospice Care Index (HCI) for the listed hospice; calculated by CMS as the sum of points earned from meeting the criterion for the 10 claims-based indicators (ranging from 0 to a perfect 10). Note: CMS HCI is based on CMS published values available on the Care Compare site.
|
| 20YY-Q# | Count of distinct patients (FFS) admitted to the listed hospice during the year and quarter identified in the header. |
| Top Patient Location County | The top county of residence for Medicare FFS patients who were treated by the listed hospice during the one-year reporting period; based on the beneficiary's county filed on the claim. |
| Top Patient Location State | The top state of residence for Medicare FFS patients who were treated by the listed hospice during the one-year reporting period; based on the beneficiary's county filed on the claim. |
| Top Patient Location % | The percentage of Medicare FFS patients treated by the listed hospice during the one-year reporting period associated with the top patient state and county. |
 Usage
Usage
The Hospices Explore page allows you to display hospices of interest to you. By creating a custom list of hospices, it is easy to always show the hospices that are most important for your planning and strategy.
 Evaluate
The numerous metrics available in the table allow you to do a deep evaluation of your own hospice, a competitor, or any other hospice of interest. The spread of patient counts provide a helpful view of the size of the historical patient population. A variety of performance metrics allow you to confirm that your hospice is keeping pace with your goals for clinical excellence.
![]() Analyze page - Keep in mind that clicking on the name of a hospice listed in the table will open the Analyze page for that hospice, which includes even more detailed metrics for evaluation.
Analyze page - Keep in mind that clicking on the name of a hospice listed in the table will open the Analyze page for that hospice, which includes even more detailed metrics for evaluation.
 Compare
Using the same metrics in the Hospices Explore table, you can compare multiple hospices to see how your hospice compares to the competition.
![]() Market Share Report - On the Reports page, you can perform a detailed evaluation of a selected market, comparing the market share of patients for all hospices in the market, including market share trends over two years.
Market Share Report - On the Reports page, you can perform a detailed evaluation of a selected market, comparing the market share of patients for all hospices in the market, including market share trends over two years.
